When I used to teach management students, I would often start with a graphic that showed the organisation as an engine where we used an injection of various assets (inputs) to power the engine. This engine operated to produce an output of products and services in return for cash that we could then use to purchase more inputs to make the engine bigger and more powerful. So, like most engines, they can operate for extended periods of time with little maintenance. However, after time things don’t work so well.
Using the engine analogy, there might be a need to consume more fuel and oil to get the same degree of output if we don’t pay close attention to the important aspects of the system. Fuel economy drops, we hear rumbles that never used to exist, and we start to experience a lack of reliability and occasional breakdowns.
The more I think about this the more the analogy is reinforced. High performance engines need a range of specialists to keep them operating at their optimal condition. These specialists all work together to monitor a diverse range of metrics, each measure relevant to the individual technician but all contributing to the overall performance. It’s the balance of these metrics that lead to optimal performance, not one measure to the exclusion of all others.
In business these days, how often do we see people in offices pouring over particular numbers, working in isolation form the rest of the team often seeing their output more important than that of others? Figures are reported on independently of how they influence the overall function of the economic engine.
If you look at motor sport and the amount of technology involved with monitoring every minor detail, every single reading is taken for a purpose. How are we tracking, is everything working together to achieve the result? Are there any developing problems that will affect the output? What corrective action can be taken to avoid a major problem?
These concepts can be adopted by mangers in all businesses as a way of keeping their finger on the pulse of the organisation.
CEO or Chief Engineer?
The Chief Executive Officer is the one charged with the overall operational performance of the organisation. It is the role of the CEO to ensure that all the measures that are being monitored by the team are benefitting the company overall. Like the Chief Engineer in a motor sport, the CEO has to ensure that each team member is doing their job and that the overall objective is not compromised. Two key questions that the CEOs should be asking themselves are “Are all the inputs being used efficiently to optimise the output?” and “How can I be sure?”
The Value of a Dashboard
Just like a complicated engine with many critical moving parts operating under high stress, a business needs an effective dashboard that constantly provides meaningful feedback on the performance of the various business systems contributing to the success of the company.
There are numerous businesses who limit their dashboard view to simply a view of the Profit and Loss. This is much like driving a racing car with nothing more than a speedometer. All we know is how fast we are going right now!
Sure, knowing the ‘current speed’ of making money is important, however what about the indicators that show the status of the multitude of items that can impact the ‘speed’ in the future?
For example, what is the staff absenteeism or staff turnover rate? How are gross margins by product line? What is the accident and injury rate? Do we track ‘near misses’? What does our customer base tell us? What level of complaints exist? What trends can we detect in relation to sales / customers/ profitability? What about sales revenue per employee hour or equipment hour worked? How’s the operating expense in relation to our sales volume? What environmental factors can impact our business? How are we tracking month to date or year to date with sales against budget or forecast?
What Makes a Good Dashboard?
As every business operates a bit differently, there is no one best template for a dashboard for an organisation. It really is up to senior management to articulate the measures that have the most significant impact on the operation of the business. Although there is no ‘one best way’ there are a few tips that I think are relevant for every dashboard.
- Be clear on the audience for the dashboard
- Keep a small number of key metrics at the top
- Use colour coding to aid understanding
- Green all OK
- Orange or Yellow warning, attention may be required
- Red – alert or corrective action required
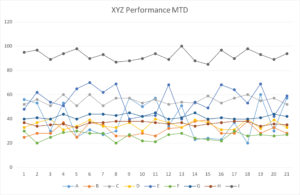
- When using graphs, simple is best. Avoid numerous overlaid lines like the type of chart shown here.
- Pie charts are good to show relative proportions.
ADD PIE CHART
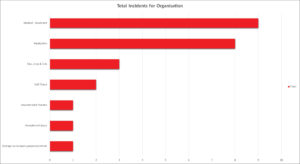
Bar graphs are clear and can be sorted in a variety of ways to aid clarity.
- Consistent colours for categories/sites/products etc
- Have a hierarchy of dashboards if there is lots of data to monitor to assist in ‘drilling down’ to problems
- Keep each dashboard simple
Remember the purpose of the dashboard is to give people timely, relevant, useful feedback to indicate that things are on track or if there is something developing that needs further attention.
How Hi-Tech Does The Dashboard Need To Be?
ADD IMAGE
In short, not very!
I often get asked by managers if specific software for creating dashboards in needed. Although there is some great software available for all sorts of situations, I generally encourage people to use the tools that are already available in their business to start. Many organisations that need a dashboard are, frankly, not in a position to afford expensive new custom software that requires specialist training to develop and maintain. I’m very much of the opinion of ‘walk before we run’ when it comes to implementing solutions.
Just about every organisation has data and some form of spreadsheet application. With a bit of thought, these can be used to great effect to create meaningful dashboards that provide business managers with the insights they need to help them make the right operational and strategic decisions for their organisation.
My one caveat in relation to creating a good dashboard is that the data needs to be ‘clean’. Clean data is free from typo’s in the key fields, the usual culprits are bad date formats and extra spaces in category identifiers. These can usually be overcome quite easily by having spreadsheets or databases with some validation of the data entry to alert the user to errors.
One last tip on dashboards is that they can develop over time to include other items to make them more useful as the needs of the business grows. If you are just starting out with a dashboard, you don’t have to create the perfect dashboard straight away, start with something that’s of interest and let it evolve as your needs develop.
John Yealland is a management consultant and process improvement expert who has worked with business leaders in a wide range of industries to help them improve the performance of their organisation.